How to read DISC test results
A detailed guide to interpreting the charts and understanding your behavioral profile
Sample data
Three DISC charts
Chart descriptions
Chart 1 (Work behavior)
Shows how you usually behave in work situations.
Chart 2 (Behavior under pressure)
Reflects your reaction in stressful situations or under high load.
Chart 3 (Self-perception)
Shows how you see your own behavior in different situations.
DISC map: how behavioral styles are arranged
DISC is easier to grasp not only as four separate letters but as a circle of styles. This map shows how the core directions D, I, S, and C blend into mixed behavioral zones.
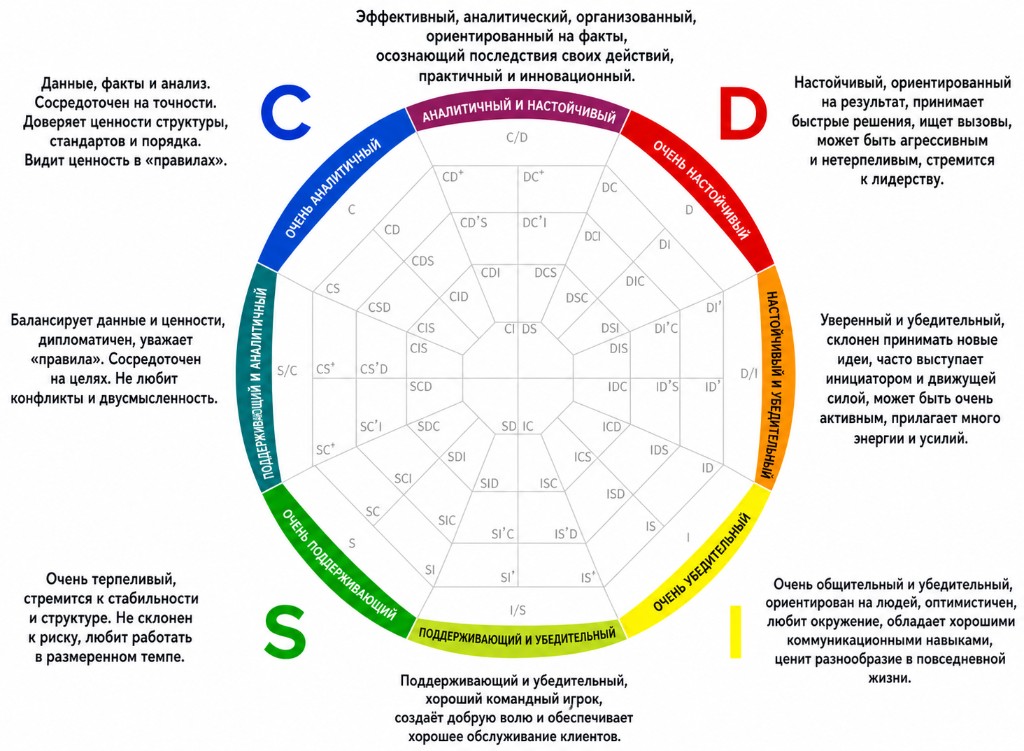
The circle helps you quickly understand the model:
- D is closer to decisiveness, drive, and results focus;
- I — to communication, influence, and interaction energy;
- S — to stability, patience, and support;
- C — to accuracy, structure, and analysis.
Important: most people are not described by a single letter. Profiles often sit between several styles. Combinations like DI, IS, SC, or CD can be more useful than hunting for one “main type”.
If you cannot see all four columns, scroll the table to the right →
Strong work-side traits
Factors above the center line
D - Dominance
- Assertive
- Competitive
- Direct
- Strong-willed
- Decisive
- Inquisitive
- Enterprising
I - Influence
- Sociable
- Friendly
- Influential
- Outgoing
- Persuasive
- Positive
- Verbal
S - Steadiness
- Good-natured
- Reflective
- Reliable
- Good listener
- Kind
- Methodical
- Conscientious executor
C - Conscientiousness
- Neat
- Cautious
- Rule-abiding
- Logical
- Perfectionist
- Precise
- Systematic
Support factors
Factors below the center line
D - Dominance
- Accommodating
- Low need to decide
- Gentle
- Undemanding
I - Influence
- Investigative
- Thoughtful
- Reserved
- Serious
- Skeptical
S - Steadiness
- Active
- Agile
- Demonstrative
- Mobile
- Restless
C - Conscientiousness
- Firm
- Independent
- Persistent
- Determined
- Stubborn
Based on sample data
Sample chart analysis
1
Chart 1 — Work behavior
- A dominant I (Influence) score points to a strong communication focus in work situations.
- C sits in the support zone, suggesting a preference for flexibility and firmness at work. Because C is not far from the midpoint, this shows up moderately.
2
Chart 2 — Behavior under pressure
- Higher D and C under stress indicate more persistence and decisiveness (D).
- At the same time, critical thinking and attention to detail (C) increase.
3
Chart 3 — Personal behavior
- Shows natural behavior in a comfortable, relaxed setting.
- Comparing it with work behavior helps you see how much you adapt across contexts.
Key interpretation principles
Comparing charts
- Large differences between charts suggest adaptability
- Similar charts suggest stable behavior patterns
FAQ
Frequently asked questions
What does chart 1 show in DISC?
Chart 1 reflects work behavior: how a person usually interacts in typical tasks and communication.
Why compare charts 1, 2, and 3?
The comparison shows how behavior shifts between work context, stressful situations, and personal style.
Can I draw conclusions from one high scale alone?
No. Sound interpretation considers the combination of D, I, S, and C and how they move across charts.
Ready to discover your profile?
Take the DISC test and get a personal analysis of your behavioral style with practical recommendations